
[EN] Loopback with Mellanox ConnectX-6, single port and iperf3
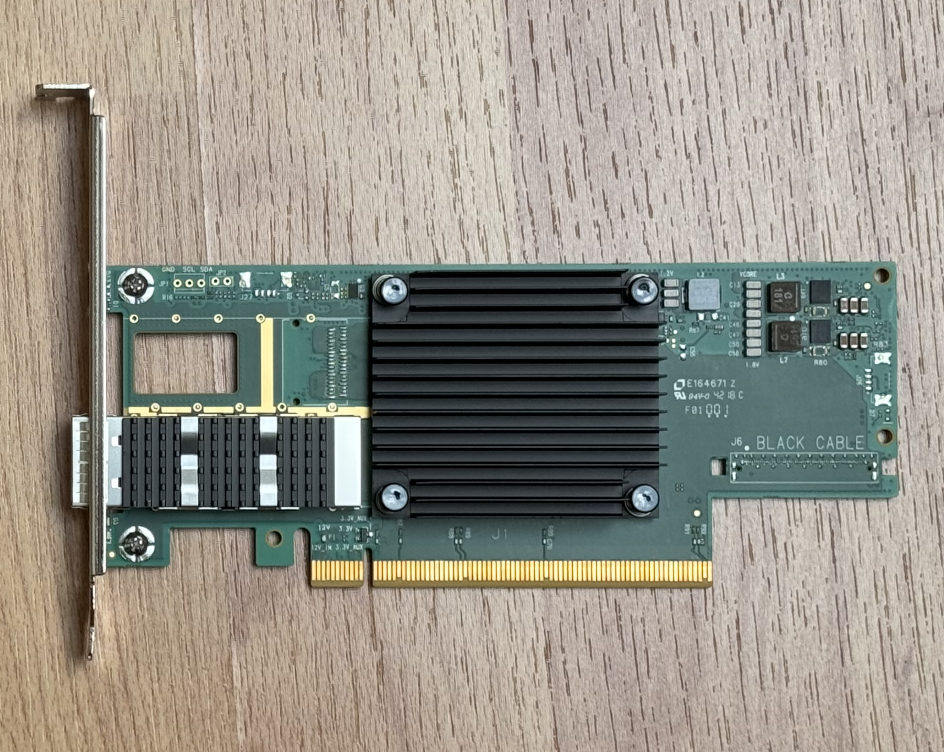
I recently acquired a single-port Mellanox card. Since optical fibers offer much more flexibility compared to CAT7/8 RJ45 Ethernet cables, I wanted to see if I could run iperf3 and measure performance using a single port. My setup consisted of one port on the Mellanox card, one transceiver (Intel SPTSLP3SLCWS (SFF-8636)), and a fiber jumper cable looping the TX (transmit) directly back into the RX (receive) where the optical transmission takes place.
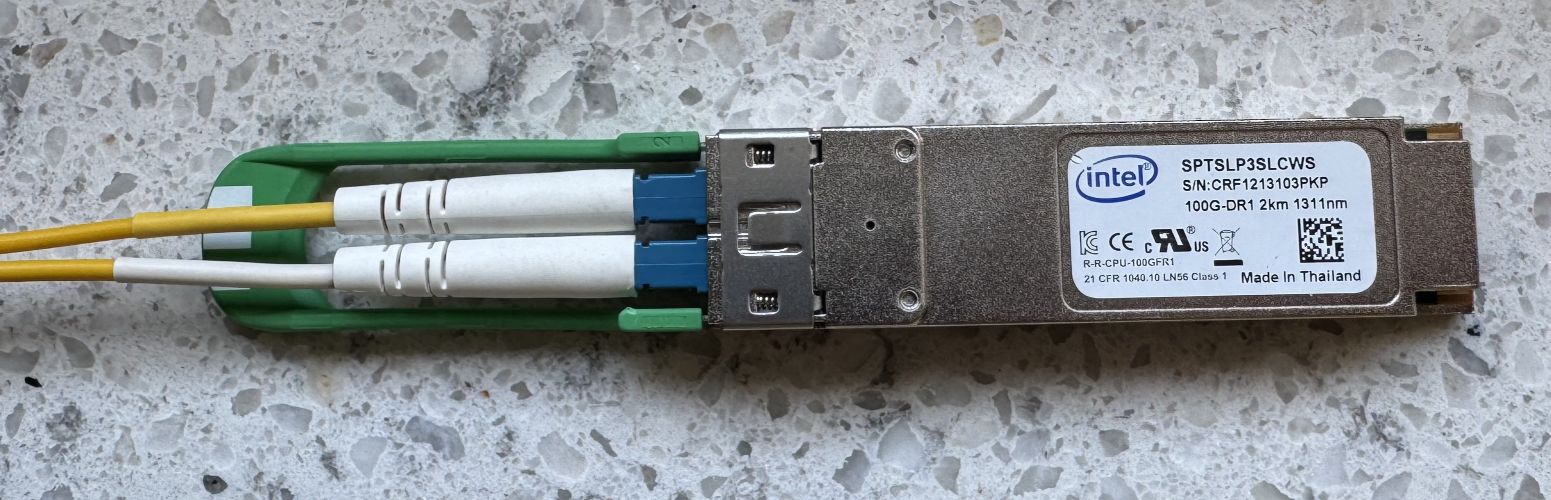
The main challenge was bypassing the kernel’s built-in optimizations so that data would actually travel through the physical device and cable rather than being processed purely in-memory. The easiest way to verify if the kernel is being bypassed is to unplug the cable during a test; the measured iperf3 bandwidth should immediately drop to zero. (Just note: I have noticed that in some cases, you may need to restart the interface after plugging the cable back in.)
Initially, when I failed to bypass the kernel, I saw speeds hitting almost 100 Gbits/sec even with the cable unplugged. This meant the kernel recognized that both the source and destination were on the same port, concluded there was no need to physically transmit the data, and instead performed a lightning-fast memory transfer capped only by the port’s negotiated link speed. In short, it wasn’t a real over-the-cable transfer.
The fundamental issue is that if Linux detects a single physical interface—even one configured with multiple IP addresses—it outsmarts the process. To trick the OS, we need to create two distinct virtual interfaces!
If you want to try this yourself, ensure that virtualization technology is enabled. Beyond enabling it globally in your BIOS, some systems also require you to explicitly activate it for PCIe cards. This feature is called SR-IOV. Alright, let’s set up this port with two addresses and bring it up.
First, check whether the host IOMMU is enabled:
$ cat /proc/cmdlineCheck if the output contains the following options:
intel_iommu=on iommu=ptNext, run the following command to check for IOMMU output:
$ dmesg | grep -e IOMMUIf you encounter an error indicating insufficient resources, you may need to adjust your kernel parameters.
Add pci=realloc to your /etc/default/grub file, then execute:
grub2-mkconfig -o /boot/grub2/grub.cfgAfterward, reboot the system.
You must also configure the Mellanox card itself to enable this feature:
mstconfig -d 07:00.0 set SRIOV_EN=1 NUM_OF_VFS=2While you can create multiple virtual interfaces, two are plenty for this experiment. You may need to reboot your computer again after running this command.
Next, dynamically instantiate the Virtual Functions (VFs):
echo 2 | sudo tee /sys/class/net/enp7s0np0/device/sriov_numvfsNow we have our virtual network interfaces. You can verify them using ip link, which should yield output similar to this:
3: enp7s0np0: <BROADCAST,MULTICAST,UP,LOWER_UP> mtu 1500 qdisc mq state
UP mode DEFAULT group default qlen 1000
link/ether 98:03:9b:92:2f:86 brd ff:ff:ff:ff:ff:ff
vf 0  link/ether 00:00:00:00:00:00 brd ff:ff:ff:ff:ff:ff,
spoof checking off, link-state auto, trust off, query_rss off
vf 1  link/ether 00:00:00:00:00:00 brd ff:ff:ff:ff:ff:ff,
spoof checking off, link-state auto, trust off, query_rss off
altname enx98039b922f86
Further down, you will see the new interfaces that we intend to bind to separate network namespaces:
5: enp7s0v0: <BROADCAST,MULTICAST,UP,LOWER_UP> mtu 1500 qdisc mq state
UP mode DEFAULT group default qlen 1000
link/ether e2:bc:67:e0:fa:7b brd ff:ff:ff:ff:ff:ff
6: enp7s0v1: <BROADCAST,MULTICAST,UP,LOWER_UP> mtu 1500 qdisc mq state
UP mode DEFAULT group default qlen 1000
link/ether fe:c7:c0:64:57:de brd ff:ff:ff:ff:ff:ff
Network Namespaces
Why go through all this trouble? By using isolated namespaces, I hoped to prevent the kernel from realizing that both interfaces reside on the same physical port. If this configuration still fails to bypass the kernel’s shortcut optimizations, I am out of ideas.
Create two isolated namespaces:
sudo ip netns add ns_server
sudo ip netns add ns_client
Now, assign the virtual interfaces to their respective namespaces and rename them:
ip link set dev enp7s0v0 netns ns_server
ip netns exec ns_server ip link set dev enp7s0v0 name eth_server
ip link set dev enp7s0v1 netns ns_client
ip netns exec ns_client ip link set dev enp7s0v1 name eth_client
Finally, assign unique IP addresses and bring the interfaces up along with the loopback devices:
ip netns exec ns_server ip addr add 192.168.100.1/24 dev eth_server
ip netns exec ns_server ip link set dev eth_server up
ip netns exec ns_server ip link set dev lo up
ip netns exec ns_client ip addr add 192.168.100.2/24 dev eth_client
ip netns exec ns_client ip link set dev eth_client up
ip netns exec ns_client ip link set dev lo upLet’s run iperf3 to see what happens. Start the server instance:
ip netns exec ns_server iperf3 -sAnd initiate the client connection:
ip netns exec ns_client iperf3 -c 192.168.100.1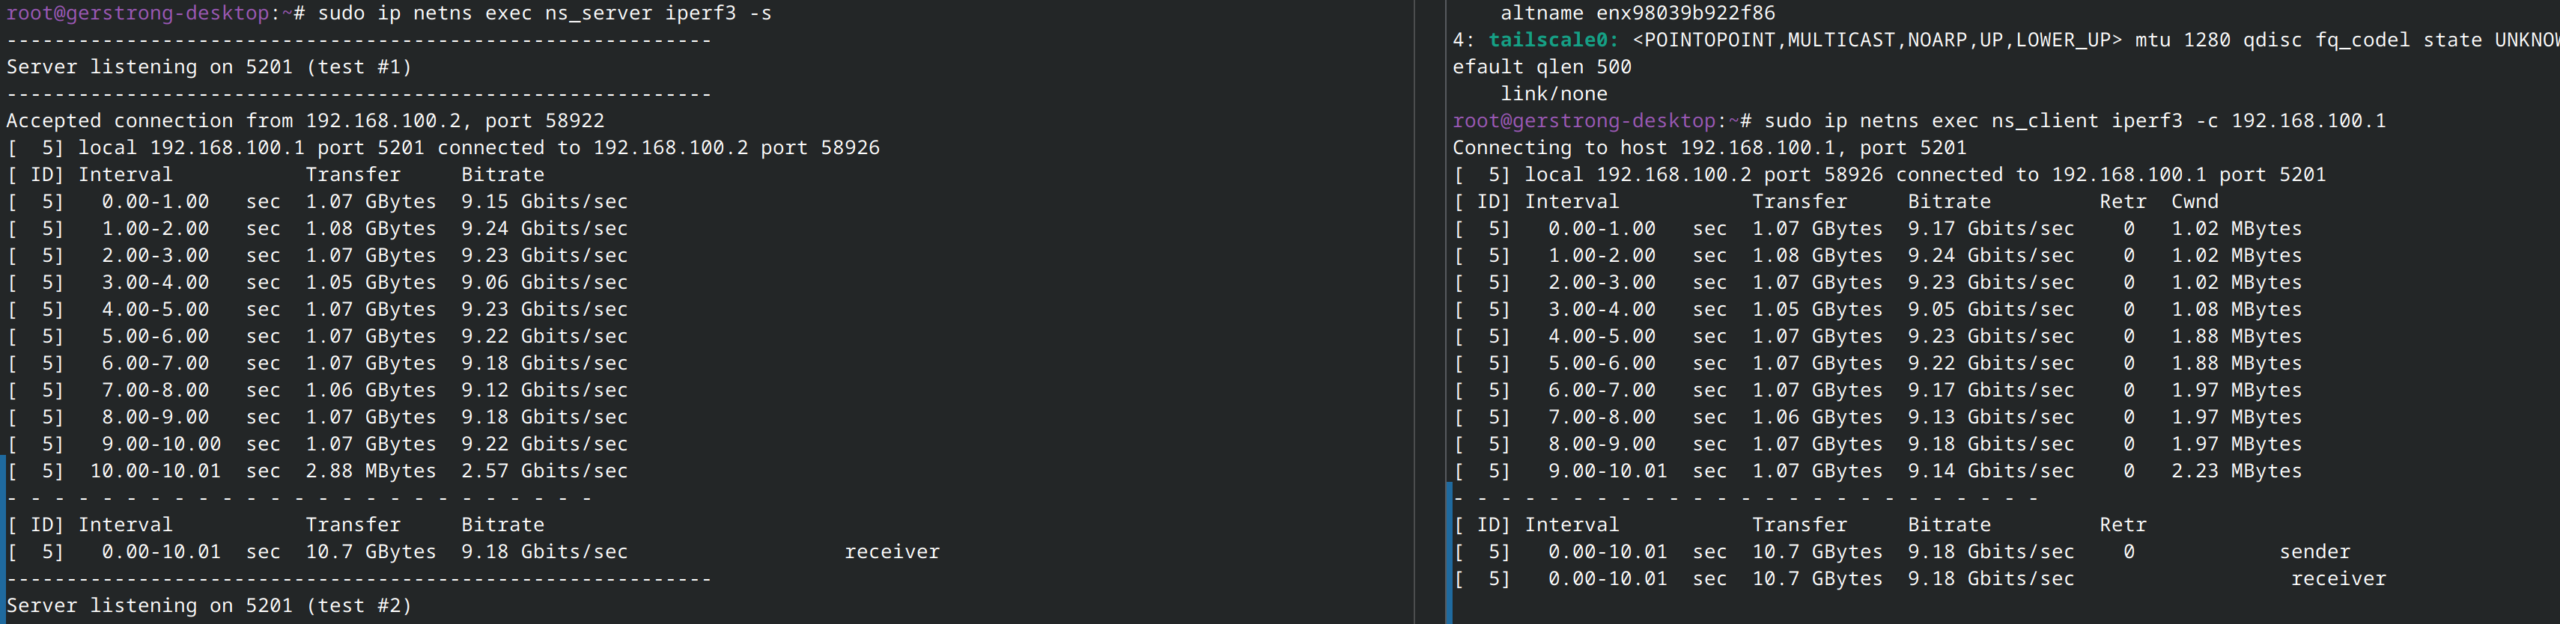
To be honest, I am getting speeds way below the full 100G capacity. However, this could easily be a hardware limitation of the workstation CPU handling the networking stack. It seems plausible.
Let’s run a longer test and disconnect the cable midway through to see how it responds:
ip netns exec ns_client iperf3 -c 192.168.100.1 -t 300I left the test running for five minutes. During the test, I completely disconnected the cable for a moment, and during a subsequent run, I deliberately bent the optical cable to disrupt the signal. The iperf3 output reacted as follows:
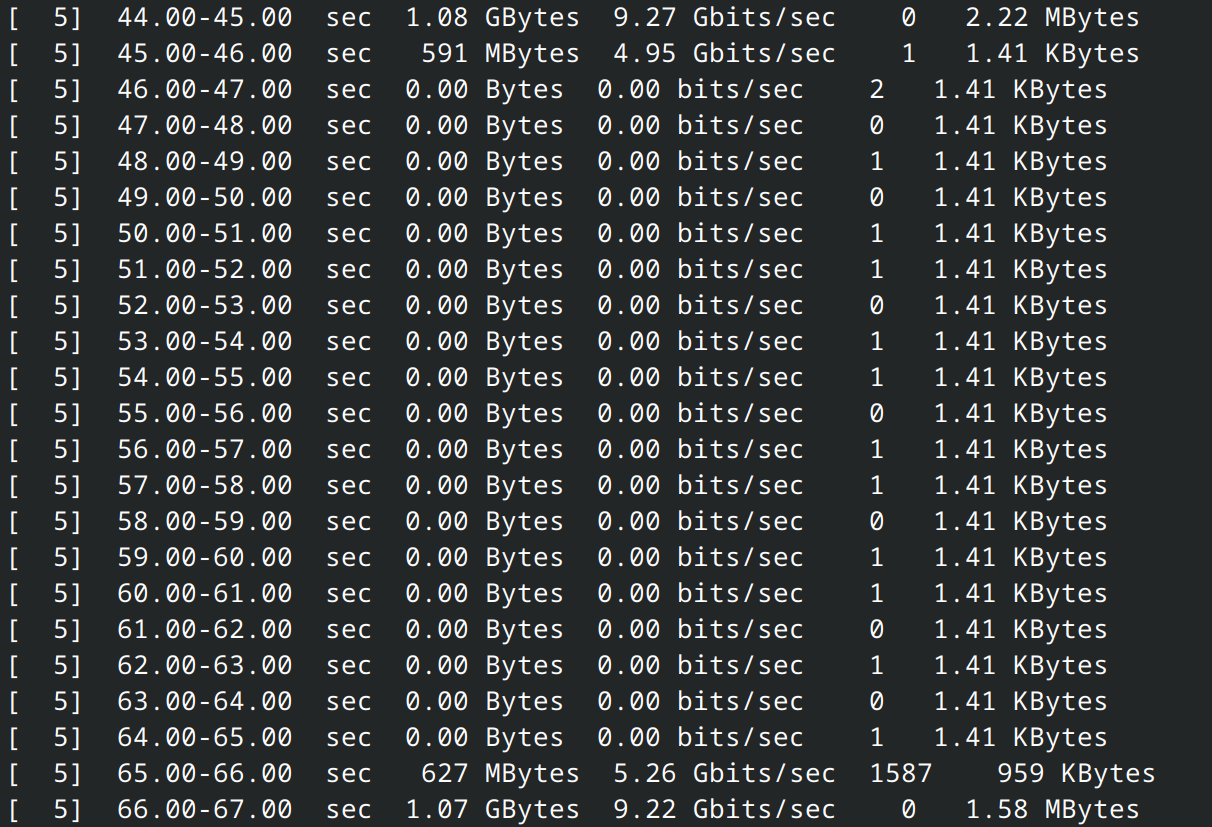
After repeating this manipulation for several seconds, I got the following test summary:
[ ID] Interval            Transfer     Bitrate        Retr
[  5]   0.00-300.00 sec   277 GBytes  7.94 Gbits/sec  8875   sender
[  5]   0.00-300.00 sec   277 GBytes  7.94 Gbits/sec         receiver
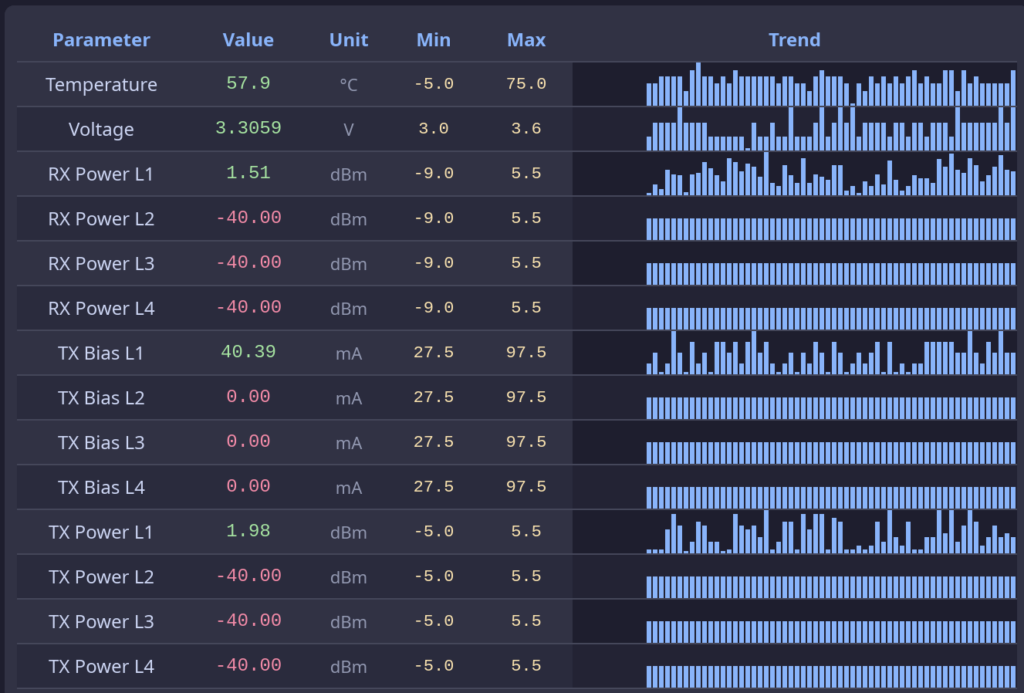
A throughput of 7.94 Gbits/sec is disappointing considering a 100G link is capable of much more. While unplugging or tightly bending the cable caused the link to drop to zero intermittently, I never observed a gradual decrease in throughput speed under poor conditions. It seems that given the performance overhead, standard fluctuations aren’t visible. Even under bad physical conditions—with the RX power dropping to around -7.0 dBm—I maintained a solid 9.20 Gbits/sec. This either speaks volumes for the robustness of the transceiver, or I am missing a hidden architectural variable here.
*(Note: ConnectX cards utilize an internal ASIC switch architecture known as an eSwitch. When multiple Virtual Functions are created on the same physical port, the hardware automatically routes packets internally between them without ever pushing the signal out to the physical transceiver or fiber loop. This explains why traffic kept flowing even when the cable was entirely removed!)*
While the transceiver was operating, I also monitored its DDM (Digital Diagnostic Monitoring):
And its VDM (Versatile Diagnostic Monitoring):
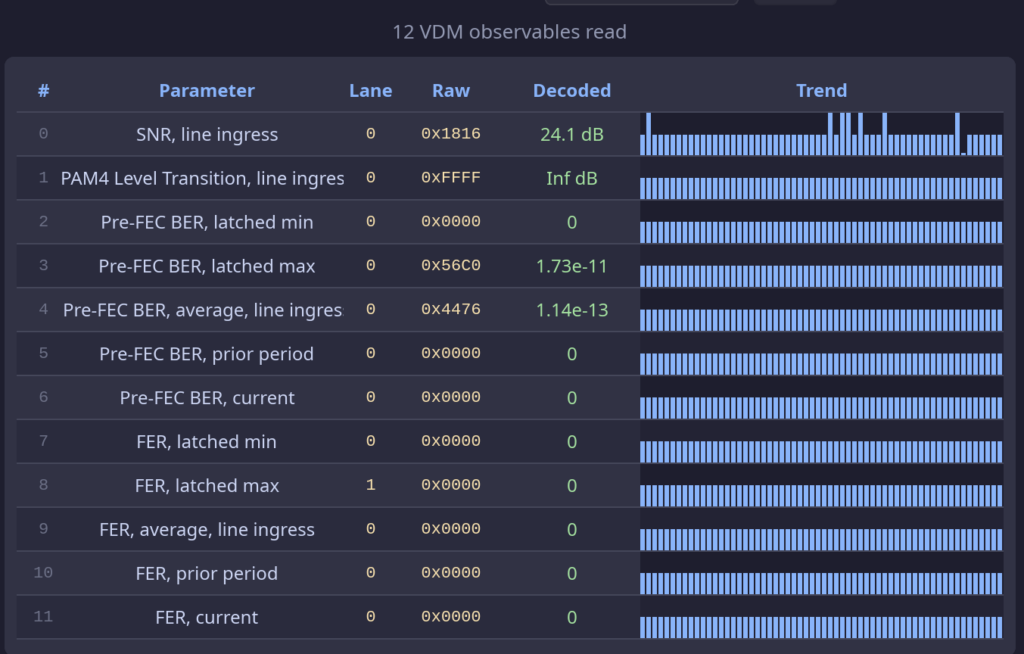
Unfortunately, I am unable to read metrics like Laser Age or Laser Temperature, and there is no data available for the Thermoelectric Cooler. The VDM output displays the telemetry registers advertised by the vendor, but for some reason, many values simply return as zeros. However, looking closely at the Pre-FEC BER (average line ingress), it is clear that the line quality, physical path, and laser are on a high level.
Jumbo Packets
Let’s re-examine our configuration. I suspect that a standard MTU of 1500 is bottlenecking the system by putting an excessive interrupt load on the host CPU. Let’s switch to jumbo frames to see if it alleviates the CPU bottleneck and increases throughput:
ip link set dev enp7s0np0 mtu 9000
ip netns exec ns_server ip link set dev eth_server mtu 9000
ip netns exec ns_client ip link set dev eth_client mtu 9000
Let’s fire up the server and client again:
ip netns exec ns_server iperf3 -s
ip netns exec ns_client iperf3 -c 192.168.100.1
Result:
- - - - - - - - - - - - - - - - - - - - - - - - -
[ ID] Interval            Transfer     Bitrate        Retr
[  5]   0.00-10.00  sec  10.7 GBytes  9.23 Gbits/sec  139   sender
[  5]   0.00-10.00  sec  10.7 GBytes  9.23 Gbits/sec        receiver
The performance remains virtually identical. Ultimately, this is a standard Linux workstation. Given these numbers, it looks like we are bumping up against a single-threaded CPU limitation rather than an interface constraint, as iperf3 relies heavily on single-core processing power.
Dropping Lower to the Hardware
Since we want to evaluate the transceiver’s raw hardware capabilities independent of the workstation’s CPU stack, let’s bypass the OS networking layer completely using lower-level firmware tools. If you are trying this at home, be sure to review the documentation:
man mstlinkHere are the hardware test commands I executed for my transceiver:
mstlink -d 07:00.0 --test_mode DS
mstlink -d 07:00.0 --loopback EX
mstlink -d 07:00.0 -a UP
mstlink -d 07:00.0 -k AU --fec_speed 100G_4X
mstlink -d 07:00.0 --test_mode EN
  --rx_prbs PRBS31 --tx_prbs PRBS31
  --rx_modulation PAM4  --tx_modulation PAM4
Querying the link status via mstlink -d 07:00.0 yielded the following output:
Test Mode Info
--------------
RX PRBS Mode                       : PRBS31
TX PRBS Mode                       : PRBS31
RX Lane Rate                       : 25.78125G
TX Lane Rate                       : 25.78125G
RX Modulation                      : PAM4 encoding
TX Modulation                      : PAM4 encoding
Tuning Status                      : PRBS mode tuning was not performed.
Lock Status                        : Locked,    Locked,    Locked,    Locked
Let’s check the underlying physical bit errors using the counter command:
mstlink -d 07:00.0 -cResults:
Test Mode Info
--------------
RX PRBS Mode                       : PRBS31
TX PRBS Mode                       : PRBS31
RX Lane Rate                       : 25.78125G
TX Lane Rate                       : 25.78125G
RX Modulation                      : PAM4 encoding
TX Modulation                      : PAM4 encoding
Tuning Status                      : PRBS mode tuning was not performed.
Lock Status                        : Locked,    Locked,    Locked,    Locked
Physical Counters and BER Info (PRBS)
-------------------------------------
Time Since Last Clear [Min] : 0.0
PRBS Errors : 0,0,0,0
PRBS BER : 0E-0Note that the „Time Since Last Clear“ metric defaults to 0.0 right after execution (you can manually flush these counters using mstlink -d 07:00.0 -pc). Let’s let the hardware run for a longer period. I monitored the link over an 8-minute window while intentionally unplugging and reconnecting the physical loopback cable to introduce errors. The resulting metrics were:
Physical Counters and BER Info (PRBS)
-------------------------------------
Time Since Last Clear [Min] : 8.3
PRBS Errors : 0,0,0,0
PRBS BER : 0E-0
Interestingly, even when disabling the dedicated PRBS test generator with mstlink -d 07:00.0 --test_mode DS, querying the physical interface counters still yields active data:
mstlink -d 07:00.0 -cOutput:
Operational Info
----------------
State                              : Active
Physical state                     : ETH_AN_FSM_ENABLE
Speed                              : 100G
Width                              : 4x
FEC                                : No FEC
Loopback Mode                      : External Local Loopback
Auto Negotiation                   : ON
Supported Info
--------------
Enabled Link Speed (Ext.) : 0x000007f2
(100G_2X,100G_4X,50G_1X,50G_2X,40G,25G,10G,1G)
Supported Cable Speed (Ext.) : 0x00000200 (100G_4X)
Troubleshooting Info
--------------------
Status Opcode : 0
Group Opcode : N/A
Recommendation : No issue was observed
Tool Information
----------------
Firmware Version : 20.33.1048
amBER Version : 5.75
MSTFLINT Version : mstflint 4.34.0
Physical Counters and BER Info
------------------------------
Time Since Last Clear [Min] : 0.4
Effective Physical Errors : 0
Effective Physical BER : 15E-255
Raw Physical Errors Per Lane : 0,0,0,0
Link Down Counter : 1
Link Error Recovery Counter : 0
Raw Physical BER : 15E-255The reported BER is exceptionally low, indicating that the hardware’s internal Forward Error Correction (FEC) mechanism cleanly rectifies physical-layer transmission anomalies, ensuring a stable, error-free 100G framework post-FEC. Unsurprisingly, removing the fiber jumper entirely or bending it past its structural tolerance causes the transceiver to lose its physical link, halting the monitoring logic and displaying N/A across the board:
Physical Counters and BER Info
------------------------------
Time Since Last Clear [Min]        : N/A
Effective Physical Errors          : N/A
Effective Physical BER             : N/A
Raw Physical Errors Per Lane       : N/A
Link Down Counter                  : N/A
Link Error Recovery Counter        : N/A
Raw Physical BER                   : N/A
Let’s take a closer look at the Pre-FEC Bit Error Rate—the raw signal error metrics captured before the ASIC applies algorithmic corrections:

Eventhough I was able to simulate a broken link, with loss of signal the BER was being reset to zero. In between transitions of connecting and disconnecting, I was able to capture values which were quite good. You have to be careful with this transceiver though: unstable links may give a false impression of that everything is alright by just looking at the BER. Check the RX power which really tells if the signal with that kind of scenarios get messed up. The maximum recorded value spiked at 1.77e-11, implying a good baseline bit error rate. Looking at the average value over a 10-minute window stable link the average stabilized down to around 1.10e-12.
Conclusion
While Mellanox (Nvidia) provides powerful deep-dive utilities for hardware analysis, I highly recommend leveraging the real-time DDM and VDM telemetry registers directly on your optical transceivers to reliably evaluate baseline signal integrity.
If you want to run benchmarking tests like iperf3, the only foolproof approach is to use two separate physical ports connected via two independent transceivers. Using separate cards or ports ensures the Linux kernel and the hardware’s internal eSwitch loopback short-circuits cannot bypass the physical cable link. I spent a few days wrestling with virtual functions and network namespaces to make a single-port loopback behave like a real link, and it proved to be a fantastic learning experience regarding just how aggressive modern kernel and NIC optimizations really are.
I suspect this particular second-hand transceiver I bought on eBay might have seen better days. The VDM register mapping remains spotty, and while the module advertises support for various telemetry sensors, many fields return empty. Having a fluid average error value that changes over time while the instant value consistently sits at flat zero doesn’t quite add up in my book.
Let me know your thoughts in the comments below! If you are interested in exploring high-speed homelab networking configurations further, feel free to reach out.


Neueste Kommentare